
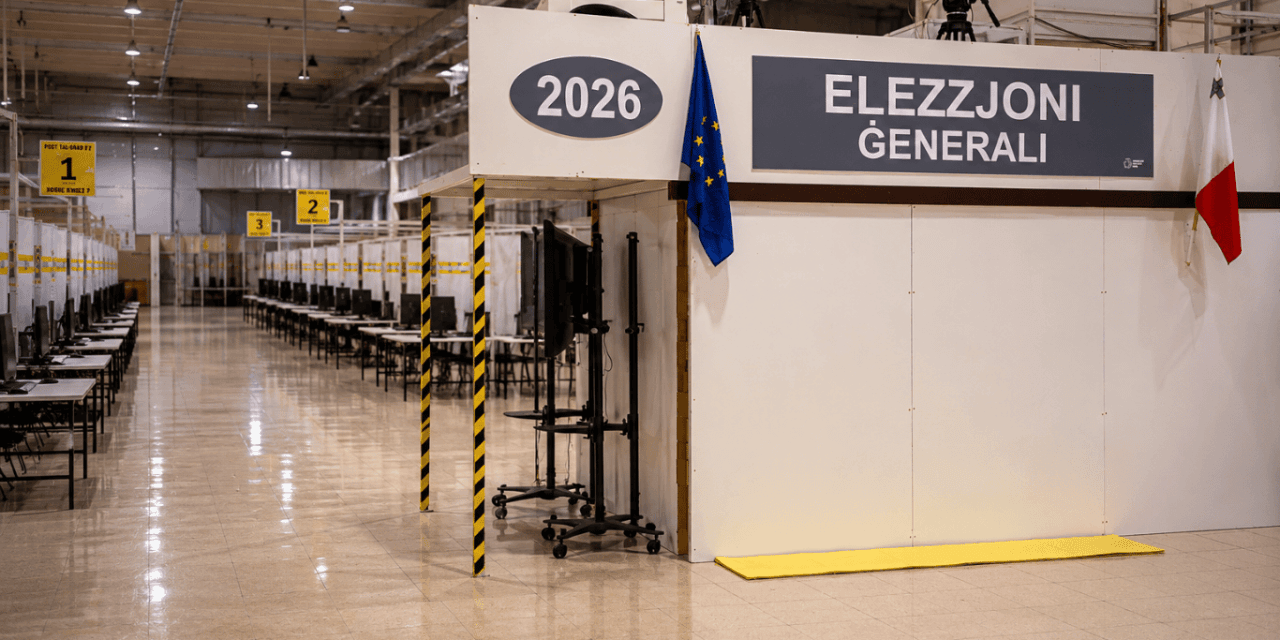
The Electoral Commission of Malta has released the approximate voting figures for the latest General Election, revealing a robust civic engagement across the islands. With an estimated 87.42% of eligible voters casting their ballots, this election marks a notable rebound in political participation and officially registers a higher turnout than 2022.
Here is a closer look at the voting statistics, district highlights, and the complete turnout breakdown.
A Rebound in Voter Participation
According to the official data provided by Assistant Electoral Commissioners at the close of voting, an estimated 311,949 voters headed to the polls out of the 356,832 registered voters.
This 87.42% turnout represents an increase of nearly two percentage points compared to the previous electoral cycle. In the 2022 General Election, voter turnout stood at 85.5% — which was considered a historic low for the typically highly engaged Maltese electorate. This year’s increase signals a renewed drive among citizens to have their voices heard at the ballot box.
District Highlights: Highest and Lowest Turnouts
Voter participation varied across Malta and Gozo, with some districts showing overwhelming turnout while others lagged slightly behind the national average.
-
Highest Turnouts: The 7th Electoral District led the nation with an impressive 89.73% turnout. It was closely followed by the 5th District, which recorded a turnout of 89.48%, and the 13th District (Gozo), which saw an 89.43% participation rate.
-
Lowest Turnouts: On the other end of the spectrum, the 12th District registered the lowest voter turnout at 81.39%. The 10th District followed as the second-lowest, recording a turnout of 82.58%.
Complete District-by-District Breakdown
The Electoral Commission compiled these figures over the four days of voting. Below is the full approximate statistical breakdown by district:
| District | Registered Voters | Total Voted | Percentage |
| 1 | 26,834 | 23,460 | 87.43% |
| 2 | 27,347 | 24,304 | 88.87% |
| 3 | 27,903 | 24,641 | 88.31% |
| 4 | 26,438 | 23,447 | 88.69% |
| 5 | 27,353 | 24,475 | 89.48% |
| 6 | 26,779 | 23,805 | 88.89% |
| 7 | 26,511 | 23,789 | 89.73% |
| 8 | 27,882 | 24,605 | 88.25% |
| 9 | 27,264 | 23,302 | 85.47% |
| 10 | 27,658 | 22,840 | 82.58% |
| 11 | 26,687 | 23,372 | 87.58% |
| 12 | 26,334 | 21,434 | 81.39% |
| 13 | 31,842 | 28,475 | 89.43% |
| Total | 356,832 | 311,949 | 87.42% |
Note: The Electoral Commission has noted that these statistics are approximate figures collected at the close of voting.